


 Written by William Subergstaff writerReviewed by Allen Scottstaff editor
Bitcoin ‘buy’ signal excites as dollar, gold extend losses, BTC price heads past $41.5K
MarketsPublishedApr 20, 2022
Nothing stands in the way of Bitcoin’s latest renaissance, even as gold tumbles and the U.S. dollar checks its progress.

Bitcoin (BTC) closed above a crucial level into April 20 as the daily chart offered a long-awaited “buy” signal.
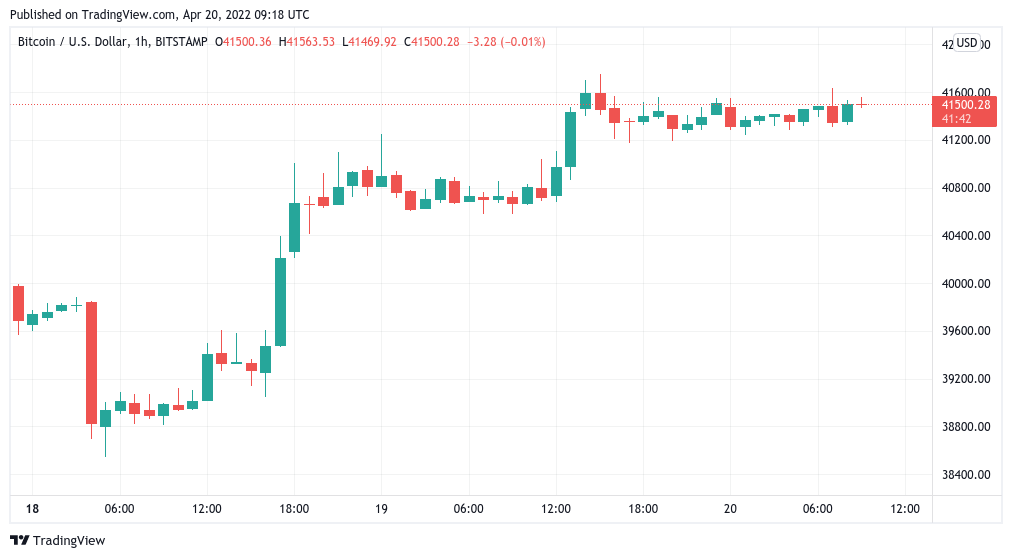
BTC/USD 1-hour candle chart (Bitstamp). Source: TradingView
Trader: Bitcoin is a buy at $41,500
Data from Cointelegraph Markets Pro and TradingView confirmed a daily close at $41,500 on Bitstamp for April 19.
The sustained gains and strong performance meant that fresh upside should be incoming, according to one trader eyeing a buy/sell indicator on daily timeframes.
Last Sell Signal was at 46K$BTC Dumped 38K
Now Buy Signal at 41K.
Note: $BTC Needs Daily Candle Close Above 41200 pic.twitter.com/AOh9XECBNI— Trader_J (@Trader_Jibon) April 19, 2022
The macro atmosphere was also in Bitcoin’s favor on the day after the U.S. dollar encountered resistance to its own bull run.
The U.S. dollar currency index (DXY) reversed after hitting 101 on April 19, its highest level since April 2020.
“DXY correction as expected, fueling the BTC bounce,” popular trader Crypto Ed responded.
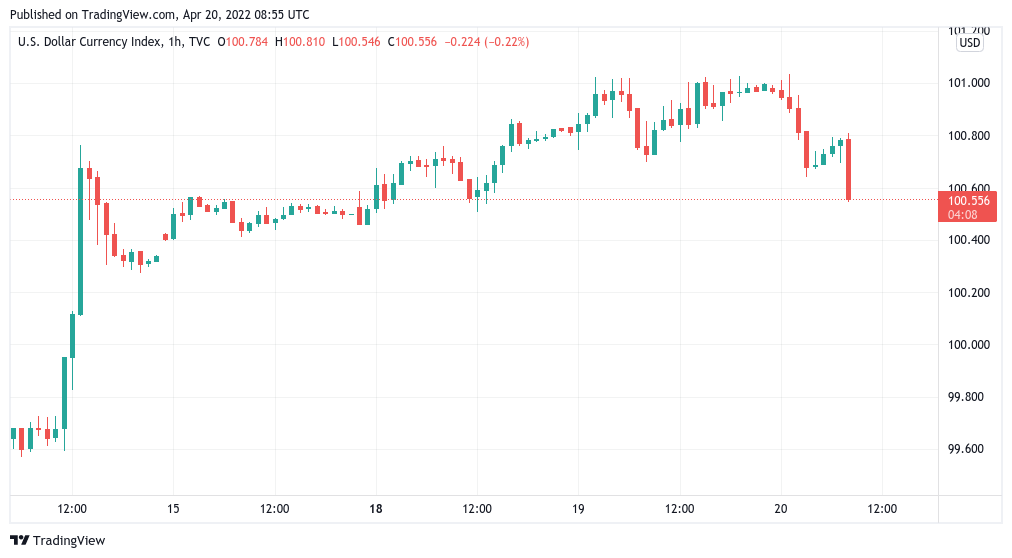
U.S. dollar currency index (DXY) 1-hour candle chart. Source: TradingView
Gold, too, faced teething problems, losing 2.6% from its $1,998 highs from earlier in the week.
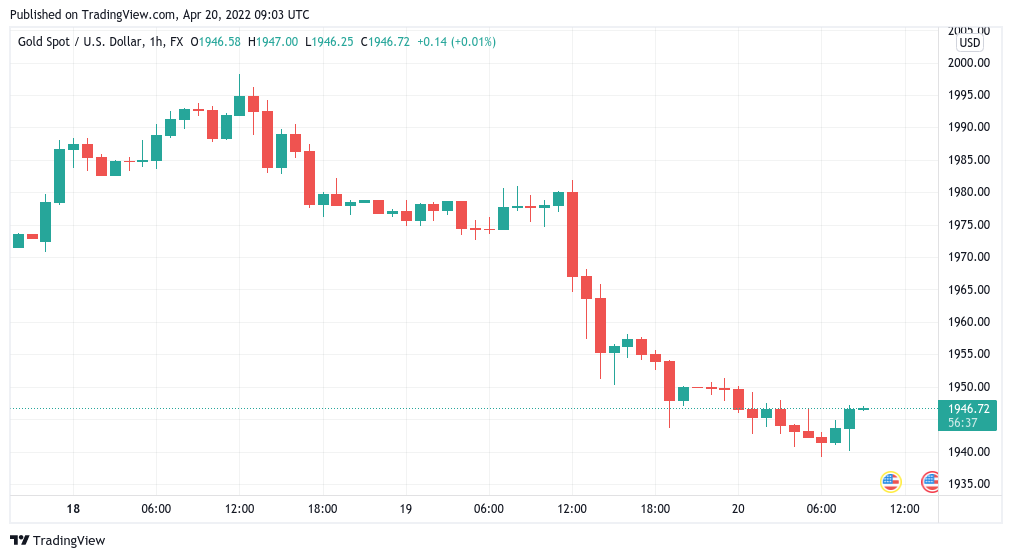
XAU/USD 1-hour candle chart. Source: TradingView
BTC price action, however, stayed near the daily close, with fellow trader and analyst Rekt Capital predicting incoming turbulence on longer timeframes.
“Bollinger Bands are tightening on price,” he told Twitter followers, referring to the Bollinger Bands volatility indicator on the weekly chart.
“This signals increasing price compression which usually precedes sharp volatility.”
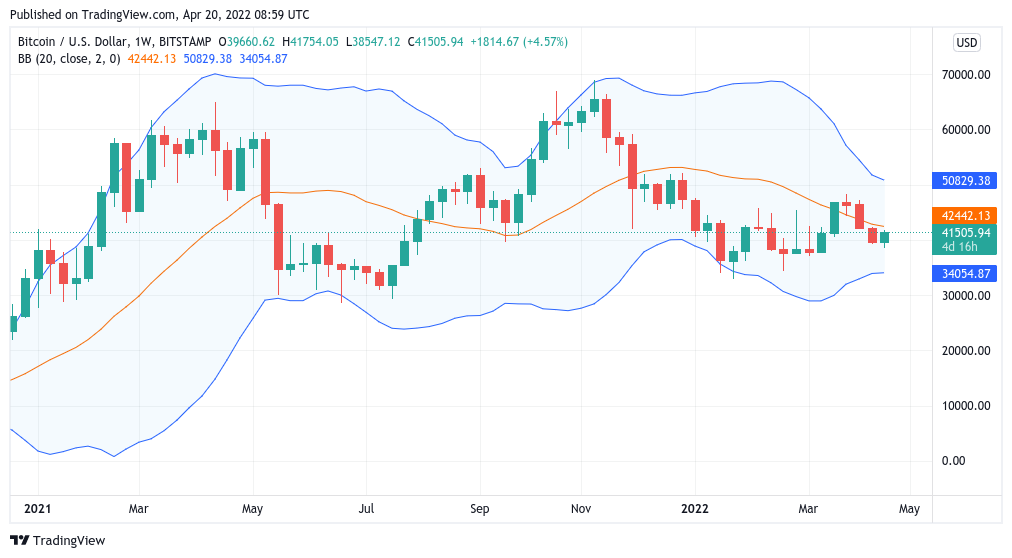
BTC/USD 1-week candle chart (Bitstamp) with Bollinger Bands. Source: TradingView
No shortage of on-chain “buy the dip” signals
On-chain metrics were just as positive on the day, with several covered by Cointelegraph continuing to suggest a bottoming structure had already been completed.
Related: Bitcoin hodlers targeting $100K is what’s preventing 40% price drawdown, data suggests
Among them was Bitcoin’s “Reserve Risk” chart, now firmly in its launch zone in what has historically preempted the start of bullish phases.
When it first returned to the target zone, analyst Philip Swift described it as being in “btfd territory.”
More formally, those buying BTC at current Reserve Risk levels have had a better chance of securing "outsized" returns in the long term.
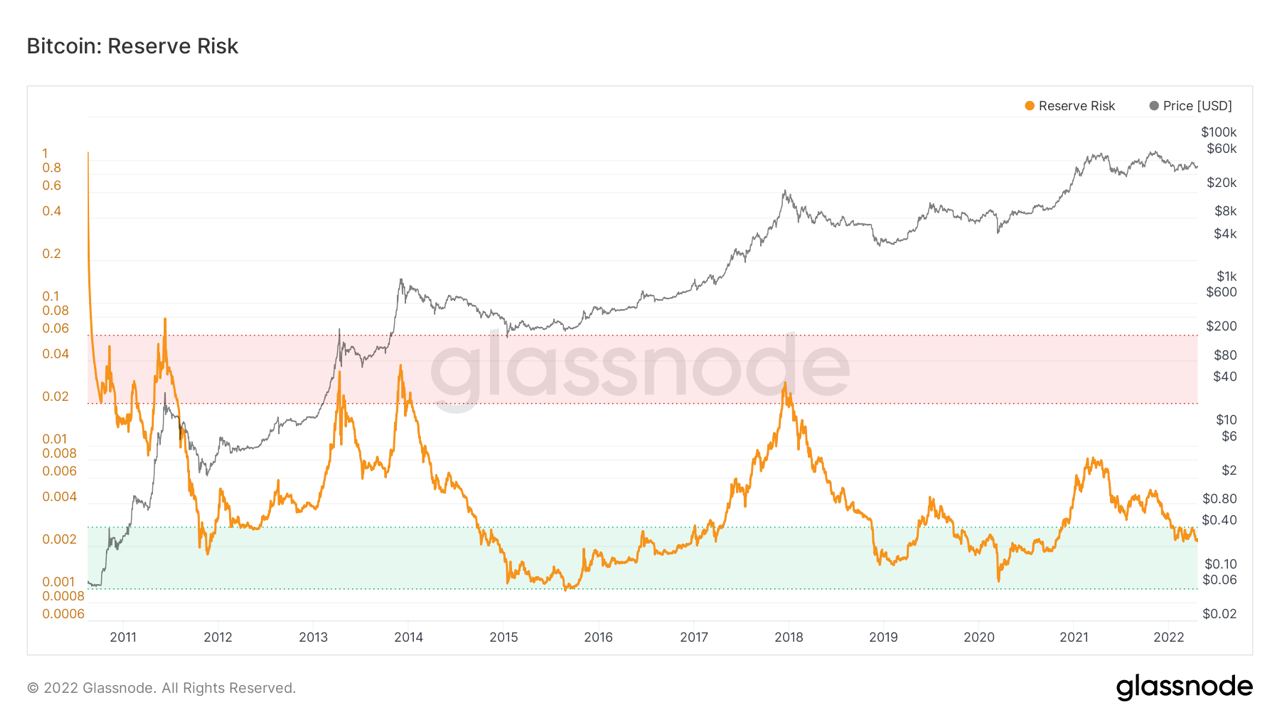
Bitcoin Reserve Risk chart. Source: Glassnode
The views and opinions expressed here are solely those of the author and do not necessarily reflect the views of Cointelegraph.com. Every investment and trading move involves risk, you should conduct your own research when making a decision.


Subscribe to daily byte-sized crypto news from Cointelegraph
This article is produced in accordance with Cointelegraph's Editorial Policy and is intended for informational purposes only. It does not constitute investment advice or recommendations. All investments and trades carry risk; readers are encouraged to conduct independent research.
More on the subject